Introduction of Prometheus

What is Prometheus?
- Prometheus is an open-source monitoring tool used for event monitoring and alerting.
- Prometheus is written in go language and it is licensed under Apache 2.0 license.
- it is used for infrastructure and customized services monitoring.
- it allows you to analyze how your applications and infrastructure are performing from the metric.
- It uses a multi-dimensional data model with time series data identified by metric name and key values pairs.
- It uses very simple query language PromQL
- To monitor the customized services, you can add instrumentation to your code, via Prometheus client libraries like Go, python, java, Scala.
- This is full-fledged monitoring system with its own alert manager.
- It can handle the millions of metrics ingestions per second.
What are the alternative monitoring tools?
Below are the alternative monitoring tools for Prometheus
1.Graphite
2.influxdb
3.opentsdb
4.nagios
5.sensu
So, question comes why we should go for Prometheus?
It has more feature than any other tools
- Provides the flexible query language
- Push gateway for collecting metrics from short lived batch jobs
- Wide range of exporters are available.
- 3rd party tools provide endpoint to tools like Graphana.
What can we monitor with Prometheus:
1.Service Metrics
2.Host Metrics
3.Uptime/Status of the website
There are 5 Stages monitoring of Prometheus:
- Data collection
- Data storage
- Alerting
- Visualization
- Analytics and monitoring.
What are the components of Prometheus?
1.Monitoring- it is the systematic process of collecting and encoding the activities taking place into target project.
2.Alert/Alerting- Alert is the outcome of an alerting rule in Prometheus that I actively firing. Alert are sent from Prometheus to the alert manager.
3.Alert manager- Prometheus servers generate the alert if thing go out the rules it sends to alert manager The job of the alert manager is grouping that alert and apply filter on them and send it via email, pagerduty, slack.
4.Target- Target is an object whose metrics are to be monitored. Target can be anything windows, Linux, or own application.
5.Instance- A endpoint you can scrape is called an instance.
Ex. 3.4.9.5:8790, 8.4.5.9:5678
Instance denoted after the colon, means 8790 and 5678 are instance.
6.Job:- Job is a collection of targets /instance.
7.Sample:- Sample is a single value at a point in the time series.
Architecture of Prometheus
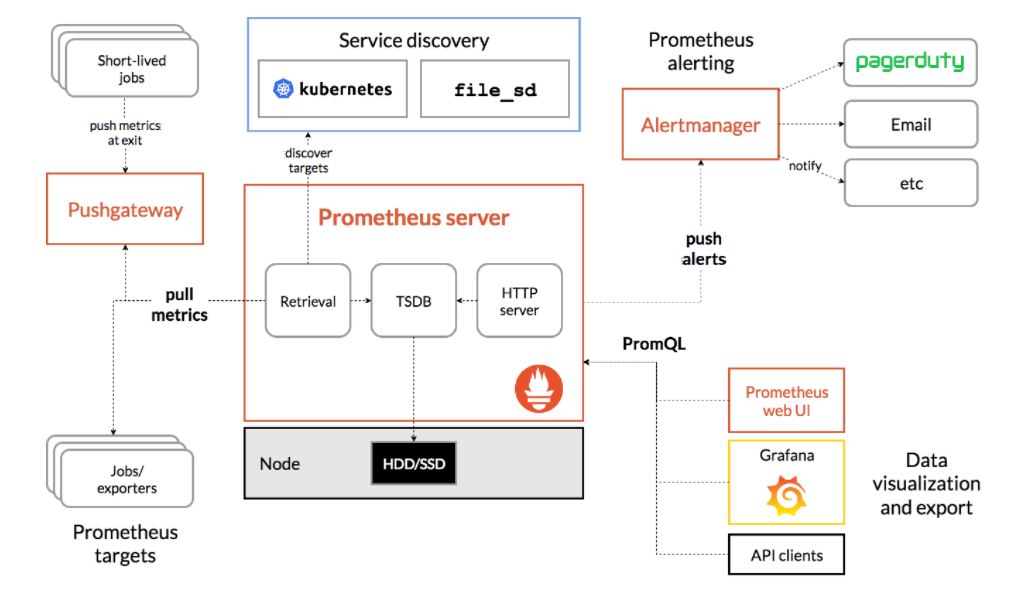
Prometheus server
Prometheus servers collect the multi-dimensional data in time series and then analyze and aggregates the collected data, this process of collecting metrics is called scraping. It pulls the metrics automatically from the targets. Hence user don’t need to push the metrics for analysis. The only we need to do expose metrics such that Prometheus can access them. For that we must create the HTTP endpoint with metrics which returns the complete metrics.
Retrival: - it helps to retrieve the data from the application endpoint.
TSDB: - Stores the metrics data so that alter it can be retrieved and analyzed.
HTTP Server: - HTTP server is responsible to push the collected data to the dashboard.
Pull Metrics
Prometheus pull the data from targets via pull method and store on the TSDB.
Pushgateway
Prometheus works on pull base model but some of the component metric cannot be pulled. Short lived job cannot be scarped through pulling metric. For monitoring these job Prometheus uses push gateway. once the push gateway fetches the metrics from Prometheus use pull method for scraping. Once push gateway push the data Prometheus server the get the data via pull method.
Service Discovery
Discovers the targets.
Alert manager
Prometheus servers push the alerts to alert manger, alert manger apply the filter on it send it via email, slack.
HTTP Server
HTTP server fetch the metrics from TSDB and push the collected metrics to the dashboard.